June 2016 Auckland Property Market Commentary
Independent market commentary courtesy of Ian Mitchell, Director, Livingston & Associates

Auckland’s property markets have continued to strengthen over the last twelve months supported by strong growth in economic activity.
An overview of the key sectors within the market includes:
-
Auckland’s office market is continuing to benefit from growth in the region’s economic activity and has resulted in growth in tenant demand for space resulting in lower vacancy rates. Prime vacancy rates remain at less than 2% putting upward pressure on rents. At the same time, investor demand continues to exceed the supply of buildings available for sale. The level of development activity has started to increase to take advantage of the strong demand for good quality space and improving market fundamentals. Market yields reflect the competitive nature of the market and remain below their long term average;
-
The industrial building investment market continues to provide superior returns to other sectors of the property market. These returns have been supported by falling low vacancy rates, growing occupier demand, increasing rents and downward pressure on yield. The level of development activity has increased with the floor area of consents issued in the year ended April 2016 totalling 360,465 square metres which was 49% higher than a year ago. However, a shortage of developable land, rising land values combined with increasing construction costs have placed upward pressure on the level of rents required to make new developments viable even with the yield compression that has occurred. As a consequence, demand for new modern premises continues to be unsatisfied; and
-
Investor demand for retail buildings has continued to outstrip the supply of units available for sale. Vacancy rates are low with tenant demand for space remaining robust despite mixed market fundaments. Like other sectors of Auckland’s economy, the growth in its population seems to be supporting growth in a variety of small and large retailers in an increasingly complex occupier market. Investor demand, particularly for buildings worth less than $5 million, continues to outstrip the number of buildings available for sale.
Figure 1 presents the trend in net annual overseas migration gains nationally and for Auckland region combined with the annual growth in Auckland house values.
Figure 1: Net Overseas Migration and House Value Growth
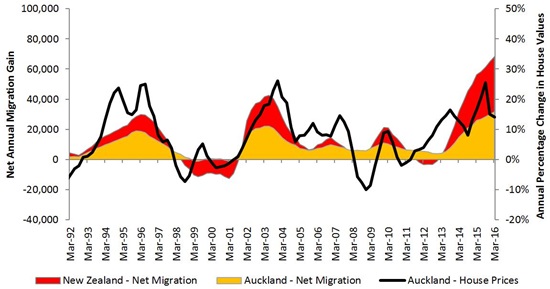
The expansion in economic activity is being supported by low interest rates, strong net migration gains, increased construction activity, and robust growth in the tourism sector.
Auckland continues to be one of the country’s fastest growing regions with its economy continuing to benefit from these trends although the majority of the growth is being driven by population growth with limited or no growth per capita.
Key indicators of future performance for the region are interest rates and the level of net migration.
Table 1 presents the trend in key market indicators by market sector.
Table 1: Property Market Indicators
| Office market | Industrial | Retail | ||||
|---|---|---|---|---|---|---|
| Last 12 months | Next 12 months | Last 12 months | Next 12 months | Last 12 months | Next 12 months | |
| Vacancies |
Down | Down | Down | Down | Down | Flat |
| Rents | Prime up Secondary up |
Up | Up | Up | Steady | Steady |
Figure 2 presents the growth in the value of commercial and industry building sales in Auckland region with sale prices in excess of $2million.
Figure 2: Commercial and Industrial Building Sales (properties selling for more than $2m in Auckland)
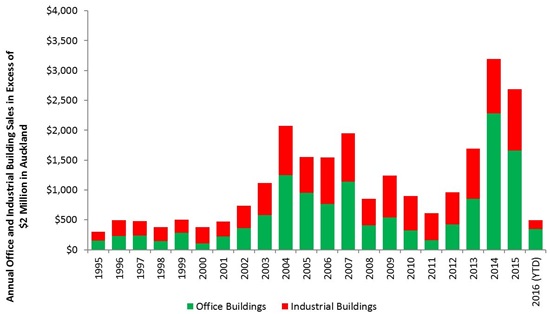
The volume of sales during 2015 was down from the peak in 2014 however continued to exceed the long term average.
The volume of sales was limited by a lack of stock rather than investor demand or access to credit.
Sales during 2016 will increase as more transactions are settled.
The challenge associated with sourcing sufficient good quality property investments in Auckland has increased investor interest in Wellington and provincial centres.
The strong competition for the stock offered for sale has placed downward pressure on yields.
Table 2 summarises current yields by sector, their outlook over the next six months and the level of investor demand.
Table 2: Yields and investor demand by sector
|
Yields
|
|||||
|---|---|---|---|---|---|
| Sector | Typical prime quality building |
Typical secondary quality building |
Outlook | Investor demand | |
| Retail | 5.00% to 7.50% |
5.00% to 8.00% |
Steady | Strong | |
| Office | 6.25% to 7.00% | 6.75% to 7.75% |
Steady | Strong | |
| Industrial | 6.00% to 6.50% |
6.25% to 7.00% | Steady | Strong | |
Investor demand remains unsatisfied across all three submarkets.
Low vacancy rates, increasing rents and low interest rates have resulted in on-going yield compression and a competitive nature of the investment market.
Yields for buildings with values of less than $2 million with good leases reflect the premium some investors are prepared to pay particularly in the current low interest rate environment.
Please note: Every effort has been made to ensure the soundness and accuracy of the opinions, information, and forecasts expressed in this report. Information, opinions and forecasts contained in this report should be regarded solely as a general guide. While we consider statements in the report are correct, no liability is accepted for any incorrect statement, information or forecast. We disclaim any liability that may arise from any person acting on the material within.


