
May 2015: In depth look at Auckland three bedroom properties
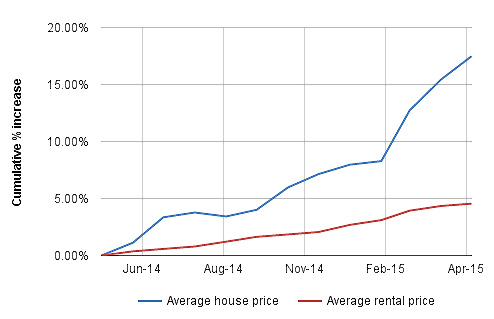
In the last 12 months, the average price for Auckland three bedroom properties increased by 17.5%, with rent increasing by just 4.26%.
The average price for three bedroom properties increased from $658,959 in June 2014, to $774,411 in May 2015 (17.5%).
In the same time period, average weekly rent across Auckland increased from $469 in June 2014 to $489 in May 2015 (4.26%).
12 month change in average house price and average rental
Greatest increase seen in lower priced areas
The increase in rentals has been greater in the lower priced areas - South Auckland, West Auckland and Franklin Manukau - suggesting renters are looking further afield to find rental properties.
The highest average rent was for three bedroom apartments in the Central City. At $852 per week, this is down slightly from this time last year ($877), but still considerably higher than any other areas and property types.
Average Auckland house prices over last 12 months (three bedroom)
| June 2014 | May 2015 | Increase in 12 months | |
|---|---|---|---|
| All of Auckland | $658,959 | $774,411 | 17.5% |
Average weekly rent over last 12 months (3 bedroom)
| May 2014 | Nov 2014 | May 2015 | Increase in 6 months | Increase in 12 months | |
|---|---|---|---|---|---|
| Central Auckland | $533 | $839 | $814 | -3.00% | 52.97%* |
| Central Suburbs | $532 | $547 | $558 | 2.03% | 4.71% |
| Eastern Suburbs | $565 | $569 | $585 | 2.85% | 3.21% |
| Franklin/Manukau Rural | $368 | $374 | $389 | 3.97% | 5.67% |
| North Shore | $505 | $518 | $529 | 2.07% | 4.08% |
| Pakuranga/Howick | $480 | $483 | $494 | 2.34% | 2.76% |
| Rodney | $440 | $446 | $461 | 3.34% | 4.75% |
| South Auckland | $394 | $404 | $419 | 3.75% | 5.85% |
| West Auckland | $418 | $430 | $442 | 2.69% | 5.38% |
| All of Auckland | $467 | $476 | $489 | 2.73% | 4.26% |
*Please note, a change in how we process data is the reason behind the extreme change here.
Current average weekly rent by type of property (three bedroom)
| Apartment | Unit/Flat | House | Townhouse | Other/Unknown | Total | |
|---|---|---|---|---|---|---|
| Central Auckland | $852 | - | - | - | - | $852 |
| Central Suburbs | $616 | $501 | $595 | $647 | $475 | $558 |
| Eastern Suburbs | $745 | $471 | $623 | $671 | $717 | $585 |
| Franklin/Manukau Rural | $335 | $363 | $409 | $393 | $528 | $389 |
| North Shore | $644 | $479 | $570 | $543 | $875 | $529 |
| Pakuranga/Howick | $593 | $481 | $544 | $487 | $707 | $494 |
| Rodney | $593 | $439 | $481 | $452 | $500 | $461 |
| South Auckland | $462 | $396 | $447 | $452 | $568 | $419 |
| West Auckland | $596 | $370 | $459 | $428 | $450 | $442 |
| Grand Total | $645 | $459 | $515 | $553 | $561 | $489 |
*Groups with less than 3 properties have been removed.
Source: Barfoot & Thompson analysis of its tenancies and sales from 1 June 2013 to 1 June 2015 for three bedroom properties. Tenancies include current tenancies and new contracts signed. Sales figures are a rolling 6 month average. Northland and Commercial sales and tenancies are excluded.