
20 years of rental data

Within Auckland
We take a look at our data over the past 20 years to examine trends in rental prices across Auckland and New Zealand.
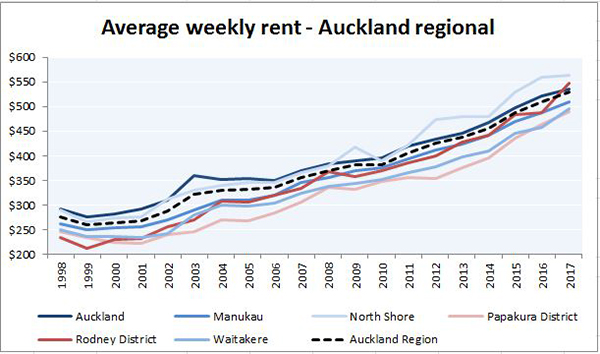
- For most of the last 10 years, the North Shore has had the highest rent per week, with an average weekly rent of $563.
- Papakura District has predominantly been the cheapest area, though for the past 3 years, Papakura and Waitakere are within a few dollars of each other.
- Over the past 20 years, Rodney District has gone from being the second cheapest area to the second highest, a gain of 133%, with the Auckland average being 92%.
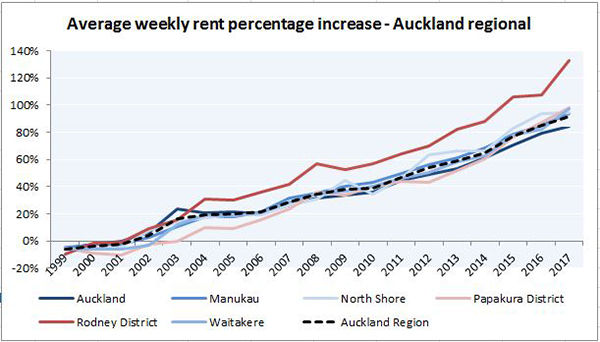
- Growth in all Auckland regions has averaged 92%, with Rodney District having the greatest rise at 133% and Auckland Central having the lowest at 84%.
- The years between 1999 and 2002 showed negative and low growth in all areas, before showing sharp growth in the subsequent years.
Auckland compared to NZ regions
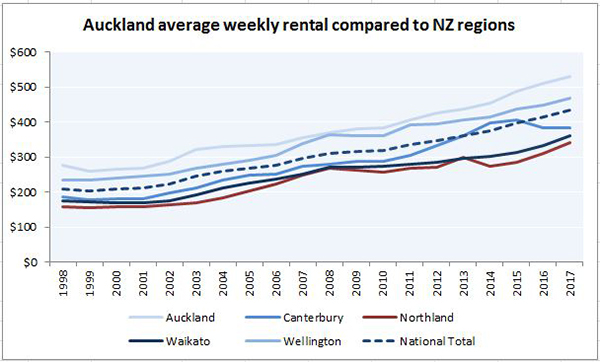
- Auckland still remains the most expensive region to rent in. In March 2017, the average weekly rental was $529, followed by Wellington at $468.
- The variance between Auckland and the other regions has increased over the past few years. Back in 2011, the difference between Auckland and Wellington was $13. Currently it is $81.
- Canterbury saw a sharp rise after the Christchurch earthquake, rising to $406 before dropping back to $384 for the past couple of years.
- Northland remains the cheapest of the areas that we analyse.
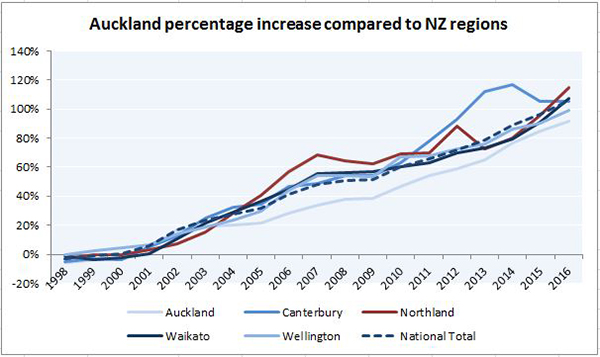
- Northland has seen the greatest percentage increase in the past 20 years.
- Auckland has had the lowest percentage increase over the years, with an increase of 92%.
- The years between 1998 and 2001 saw negative or no growth in all regions other than Wellington, which had very slow growth.
Sources: Rental data from The Ministry of Business, Innovation and Employment. Data taken from bonds received in March of each year. Not all regions are included in the analysis. Sales data from Barfoot & Thompson analytics is based on the average price for the financial year. CPI data from the Reserve Bank.