
July 2015 Auckland Property Market Commentary
Independent market commentary courtesy of Ian Mitchell, Director, Livingston & Associates

Auckland’s commercial and industrial markets continued to improve during the first half of 2015.
An overview of the key sectors within the market includes:
- The CBD office market conditions have continued to strengthen during the first half of 2015. Demand for good quality space continues to outstrip supply. As a consequence prime vacancy rates have remained at low levels (approximately 2%) placing upward pressure on rents. The lack of space has renewed interest in potential developments. Manson TCLM recently announced their plans to redevelop the NZME site with a 190 metre tower incorporating office space and a 125 bed hotel. The expected completion date is December 2018. Investor demand for office buildings continues to exceed the supply of stock available for sale
- Growth in demand for industrial space has pushed vacancy rates for prime buildings to historic lows over the last 12 months. This has resulted in occupier demand flowing over into secondary quality buildings and a surge in development activity. Rents for design build premises have increased reflecting the increased demand from occupiers, rising land prices and higher construction costs. Incentives offered to lessees have also decreased. Industrial investment has continued to be favoured by investors because of good return profiles; and
- The demand for retail property investments continues to exceed the number of buildings available for sale. Yields for sub $2 million dollars continue to reflect the strength of demand for investments and may be under-pricing the level of risk associated with these properties. Retail tenant demand remains mixed with strong competition amongst businesses placing pressure on their margins.
Auckland’s economy has continued to expand during the first half of 2015.
Figure 1 presents the trend in net annual overseas migration gains nationally and for Auckland region combined with the annual growth in Auckland house values.
Figure 1: Net Overseas Migration and House Value Growth
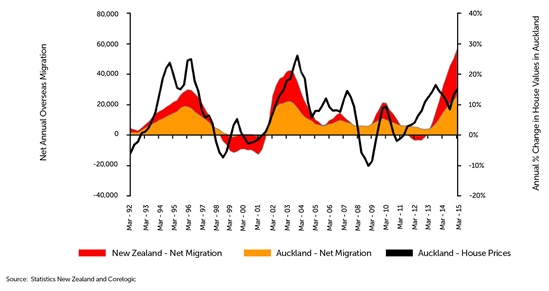
Strong overseas net migration gains have been one of the factors driving growth in Auckland’s economy which is expected to continue over the balance of 2015 supported by strong population growth and a robust construction sector.
The growth in Auckland’s economy will continue drive growth in the commercial and industrial property markets.
Table 1 presents the trend in key market indicators by market sector.
Table 1: Property Market Indicators
| Office market | Industrial | Retail | ||||
|---|---|---|---|---|---|---|
| Last 12 months | Next 12 months | Last 12 months | Next 12 months | Last 12 months | Next 12 months | |
| Vacancies |
Down | Down | Down | Down | Down | Flat |
| Rents | Prime up Secondary up |
Up | Up | Up | Steady | Steady |
Figure 2 presents the growth in the value of commercial and industry building sales in Auckland region with sale prices in excess of $2million.
Figure 2: Commercial and Industrial Building Sales (properties selling for more than $2m in Auckland)
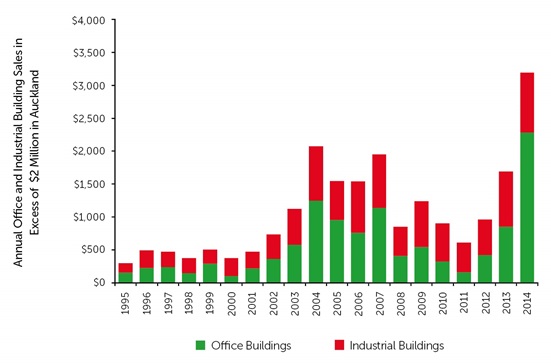
Sales during 2014 totalled over $3 billion NZD and were 54% higher than at the peak of the last cycle in the mid-2000s.
The volume of sales activity is underpinned by low interest rates, institutions reconfiguring their portfolios to fund development activity, lack of other suitable investment opportunities and the return of overseas investors particularly from Asia.
Confidence in Auckland’s commercial and industrial property investment market remains robust.
Investor demand continues to outstrip the supply of quality investment stock. It is unlikely that the volume of sales experienced in 2014 will be repeated in 2015 as a result of a lack of stock for sale.
Investors targeting the lower value end of the market are also very active. These investors typically target retail and industrial properties as their favoured investment sectors.
Table 2 summarises current yields by sector, their outlook over the next six months and the level of investor demand.
Table 2: Yields and investor demand by sector
|
Yields
|
|||||
|---|---|---|---|---|---|
| Sector | Typical prime quality building |
Typical secondary quality building |
Outlook | Investor demand | |
| Retail | 5.00% to 7.50% |
5.00% to 8.00% |
Steady | Strong | |
| Office | 6.50% to 7.25% | 7.00% to 8.25% |
Steady | Strong | |
| Industrial | 6.50% to 7.25% |
7.00% to 8.25% | Steady | Strong | |
Strong demand for property investments
Yields fell during 2014 and are now at least 100 basis points lower than they were two years ago.
They now appear to have stabilised at current levels.
The fall in yields reflect the strong demand for property investments, the liquidity in the banking sector, and the low cost of credit.
Current market sentiment reflects that interest rates are unlikely to increase in the short to medium term.
This has continued to flow through to investor confidence. In the short term strong investor demand combined with improving property market fundamentals will continue to support market values.
In the medium term, the future direction of interest rates and liquidity on world markets will have a significant impact on our capital markets.
Please note: Every effort has been made to ensure the soundness and accuracy of the opinions, information, and forecasts expressed in this report. Information, opinions and forecasts contained in this report should be regarded solely as a general guide. While we consider statements in the report are correct, no liability is accepted for any incorrect statement, information or forecast. We disclaim any liability that may arise from any person acting on the material within.