
September 2015 Auckland Property Market Commentary
Independent market commentary courtesy of Ian Mitchell, Director, Livingston & Associates

Auckland’s underlying commercial and industrial property market fundamentals continued to improve over the first half of 2015.
An overview of the key sectors within the market includes:
- Auckland’s CBD office market has insufficient prime and good quality office space to meet current demand. Vacancy rates have continued to fall and rents have continued to increase. Developers are starting to position themselves to build the next central city tower. Prime vacancy rates are now at the lowest level they have been for a number of years with the majority of vacant space concentrated in B and C grade buildings. Office building portfolio total returns have continued to improve over the last year and exceed 10% per annum
- Auckland’s industrial market has continued to experience an increase in development activity. In the year ended June 2015, industrial building consents totalled $483 million for a total floor area of 480,000 square metres. This level of development activity is approximately 110% higher than the bottom of the current cycle experienced in 2009. This reflects the growth in occupier demand combined with robust investor activity in the market and
- Demand from investors for well leased retail properties continues to outstrip the number of properties available for sale. Strong investor demand combined with the current low interest rates continues to support the current low property yields. The region’s strong population growth combined with low interest rates is contributing to a lift in the level of residential construction activity which assists in underpinning retail sales activity. However the strongest growing category of retail sales is non-store based retailing which combined with overseas internet sales is a growing competitor for traditional bricks and mortar style of retail.
Figure 1 presents the trend in net annual overseas migration gains nationally and for Auckland region combined with the annual growth in Auckland house values.
Figure 1: Net Overseas Migration and House Value Growth
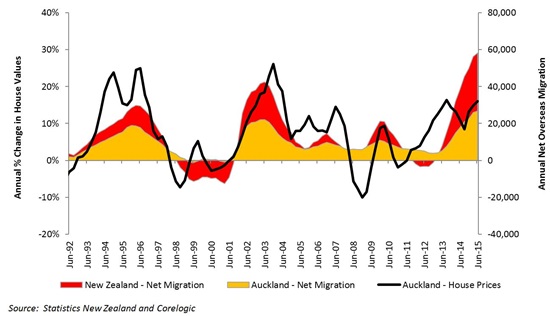
Auckland’s economy is expected to continue to grow over the balance of 2015 and 2016.
Ongoing population growth driven by high levels of net overseas migration, low interest rates and the recent falls in the relative value of the New Zealand dollar all support the continued expansion of the local economy.
The growth in Auckland’s economy will continue drive growth in commercial and industrial property markets.
Table 1 presents the trend in key market indicators by market sector.
Table 1: Property Market Indicators
| Office market | Industrial | Retail | ||||
|---|---|---|---|---|---|---|
| Last 12 months | Next 12 months | Last 12 months | Next 12 months | Last 12 months | Next 12 months | |
| Vacancies |
Down | Down | Down | Down | Down | Flat |
| Rents | Prime up Secondary up |
Up | Up | Up | Steady | Steady |
Figure 2 presents the growth in the value of commercial and industry building sales in Auckland region with sale prices in excess of $2million.
Figure 2: Commercial and Industrial Building Sales (properties selling for more than $2m in Auckland)
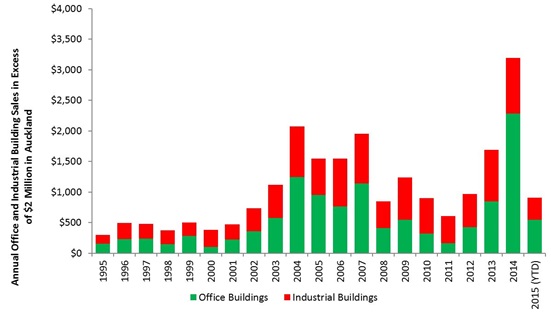
The volume of office building sales during 2014 was exceptional and a lack of stock available for sale slowed sales activity during 2015.
Sales during 2014 totalled over $3 billion NZD and were 54% higher than at the peak of the last cycle in the mid-2000s.
Investor demand from overseas and local buyers exceeds the number of buildings for sale in Auckland.
Consequently some of these potential purchasers are investigating opportunities in markets outside of Auckland which has resulted in an increase in sales activity in cities like Wellington.
Investors targeting the lower value end of the market are also very active.
These investors typically target retail and industrial properties as their favoured investment sectors.
Table 2 summarises current yields by sector, their outlook over the next six months and the level of investor demand.
Table 2: Yields and investor demand by sector
|
Yields
|
|||||
|---|---|---|---|---|---|
| Sector | Typical prime quality building |
Typical secondary quality building |
Outlook | Investor demand | |
| Retail | 5.00% to 7.50% |
5.00% to 8.00% |
Steady | Strong | |
| Office | 6.50% to 7.25% | 7.00% to 8.25% |
Steady | Strong | |
| Industrial | 6.00% to 7.00% |
6.00% to 7.50% | Steady | Strong | |
Market expectations have shifted
Yields reflect the very competitive nature of the current property investment market.
Yields for buildings with values of less than $2 million with good leases reflect the premium some investors are prepared to pay particularly in the current low interest rate environment.
Market expectations have shifted and now short term interest rates are expected to fall over the next six to 12 months as the rate of economic growth eases. In the short term strong investor demand combined with improving property market fundamentals will continue to support market values.
In the medium term, the future direction of interest rates and liquidity on world markets will have a significant impact on our capital markets.
Please note: Every effort has been made to ensure the soundness and accuracy of the opinions, information, and forecasts expressed in this report. Information, opinions and forecasts contained in this report should be regarded solely as a general guide. While we consider statements in the report are correct, no liability is accepted for any incorrect statement, information or forecast. We disclaim any liability that may arise from any person acting on the material within.